

The Math Behind Solar Payback: How to Calculate Panel ROI and Utility Savings
Engineering-level solar math: peak sun hours, system derating, panel counts, tax credits, and payback formulas. Use with our Solar Panel Calculator for precise sizing.
New to solar? Start with Is Solar Worth It? A Homeowner's Guide to Panel Costs and Payback for a practical overview of costs, incentives, and typical payback timelines. This guide goes deeper — the exact formulas contractors and engineers use to size arrays and calculate ROI.
Making the transition to solar energy is one of the most significant financial and structural upgrades a property owner can undertake. However, in an industry dominated by aggressive salespeople offering flashy, often misleading savings projections, cutting through the pitch to understand the real math of solar economics is vital.
A solar panel array is not just a green upgrade; it is a capital investment that offsets monthly operating expenses. To evaluate whether solar makes sense for your property, you must understand the underlying physics of solar energy capture, the electrical engineering of system derating, and the exact financial formulas used to determine payback and Return on Investment (ROI).
In this guide, we break down the mathematics behind solar sizing and savings. You will learn how to convert localized sunlight hours and household electric consumption into a perfectly sized system, understand how the 30% federal tax credit reduces upfront expenditures, demystify net metering models, and calculate your exact payback period using our Solar Panel Sizing & ROI Calculator.
1. Sizing the Array: Translating Consumption into Capacity
Solar energy production is measured in **kilowatt-hours (kWh)**—the same unit your utility company uses to bill you. To size a solar array that covers 100% of your energy needs, we start with your **annual electricity consumption** (available on your monthly power bills).
Because heating, cooling, and lighting demands vary drastically between seasons, sizing models must evaluate a full 12 months of utility history. Let's walk through the three core mathematical steps to translate your annual consumption into physical hardware capacity.
Step A: Establish Daily Energy Target
First, we divide your annual consumption by 365 days to find your daily energy needs. For example, if a home consumes **15,000 kWh per year**, its daily electrical energy demand is:
15,000 kWh ÷ 365 days = 41.10 kWh per day
Step B: Factor in Peak Sun Hours (The Meteorological Factor)
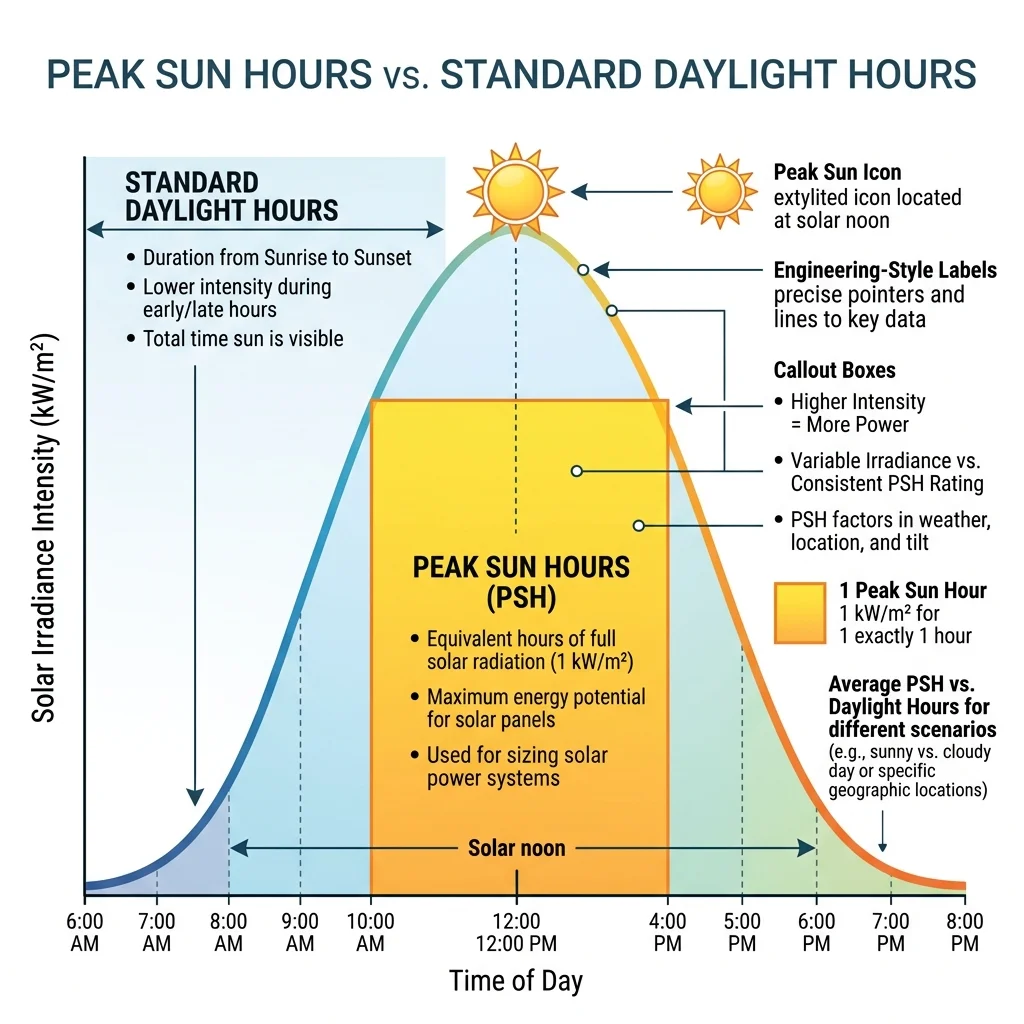
A common mistake is assuming that if the sun is up for 12 hours, you have 12 hours of solar fuel. In reality, solar panels generate negligible energy when the sun is low on the horizon, or when skies are overcast.
In engineering, we measure solar fuel in **Peak Sun Hours**. A Peak Sun Hour is not a standard clock hour; it is defined as any hour where solar irradiance reaches an average intensity of **1,000 Watts of light energy per square meter (1 kW/m²)** striking the earth.
Depending on your geographic location, your average daily peak sun hours will range from **3.0 hours** (in cloudy, northern regions) to **6.0+ hours** (in the sunny Southwest).
Step C: Factor in DC-to-AC Efficiency Losses (System Derating)
Solar panels produce **Direct Current (DC)** power under standard laboratory test conditions. However, your home's electrical panel and appliances operate on **Alternating Current (AC)**. Converting DC to AC electricity, combined with real-world site conditions, introduces a sequence of system efficiency losses:
- Inverter Conversion Loss: Modern string or microinverters operate at roughly 96% to 98% efficiency, losing 2% to 4% as heat during conversion.
- Temperature Degradation: Solar cells are semiconductors that lose efficiency as they heat up. On hot summer days, cell voltage drops, causing a 5% to 10% loss.
- Soiling & Dirt: Dust, pollen, bird droppings, and snow accumulation block sunlight, reducing efficiency by 2% to 5%.
- Wiring & Resistance: Small voltage drops occur as current travels through long copper wire runs.
To account for these combined real-world variables, engineers apply a standard **DC-to-AC derate factor of 0.78** (equivalent to a 1.3 degradation multiplier). Sizing a system without this multiplier leads to a system that is continuously under-producing.
Solar System Size Equation
Where Psystem is the required DC system size in kilowatts (kW), Edaily is your daily energy target in kWh, and Sun Hours is your regional peak sun hours.
Example: For a daily demand of 41.10 kWh in a region with 4.5 Peak Sun Hours: 41.10 / (4.5 × 0.78) = 11.7 kW DC system size.
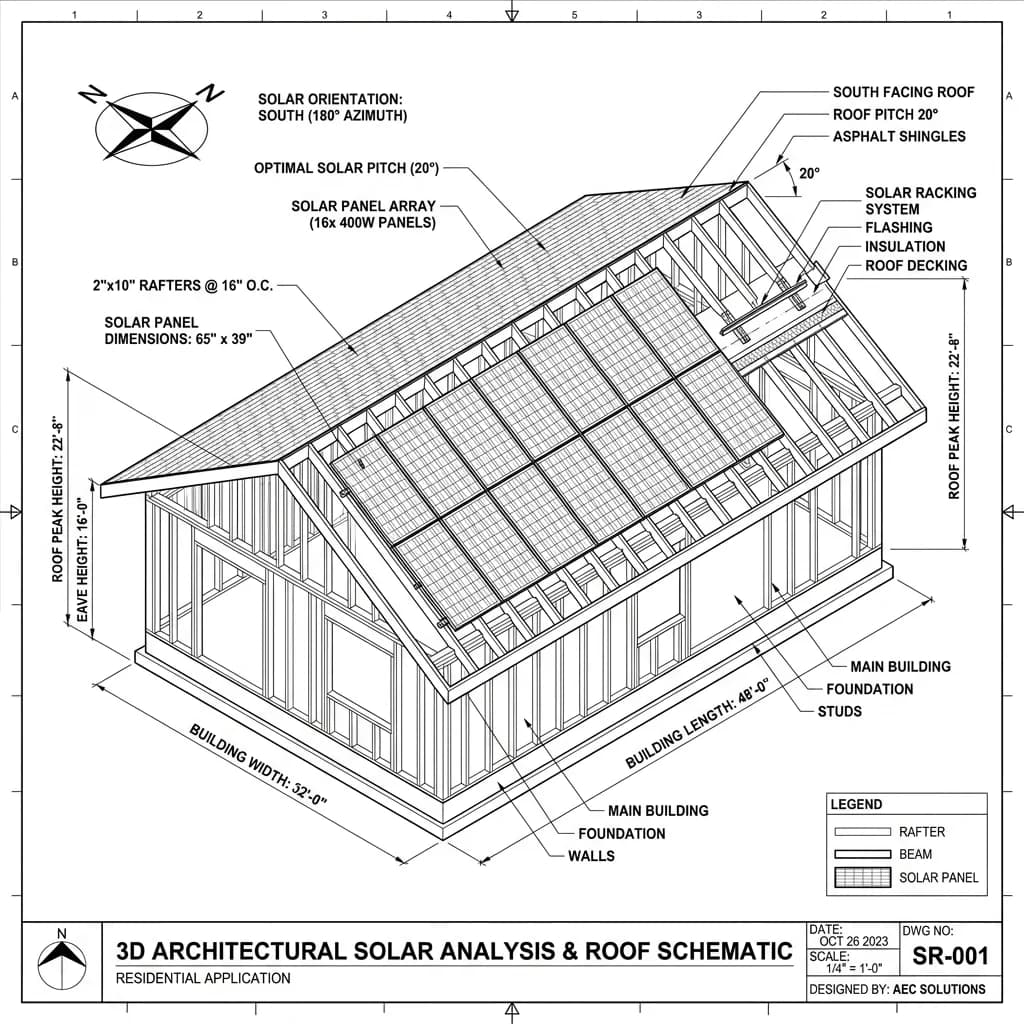
2. Physical Layout and Roof Boundaries
Once you have calculated the required system size in kilowatts (kW), you must convert that target capacity into the physical number of panels and verify if your roof has enough available, unshaded surface area.

A standard residential solar panel measures approximately **5.4 feet long by 3.25 feet wide**, occupying roughly **17.5 square feet (1.63 m²)**. Standard panel outputs range from 350 to 450 Watts of DC capacity.
Using standard 400-Watt panels to meet the 11.7 kW (11,700 Watts) target calculated above:
11,700 Watts ÷ 400 Watts/panel = 29.25 → 30 panels
To install 30 panels, you require a minimum clear roof space of 30 × 17.5 = **525 square feet**.
When planning, remember that building and fire codes generally require a **3-foot perimeter pathway** along the eaves, ridges, and valleys of the roof. This pathway allows emergency firefighters to navigate the roof safely for ventilation. Sizing layouts must respect these safety boundaries, which reduces the active area available for solar panels. Slabs, walls, and perimeters can be measured using our Area & Perimeter Calculator.
3. The Financial Formula of Solar ROI
Evaluating solar as an investment requires walking through the upfront capital costs, applying government tax incentives, and calculating your annual operational offsets.
Step 1: Gross System Cost
Solar installations are priced based on a **Cost per Watt** metric. In the United States, the average cost ranges between **$2.80 and $3.20 per Watt** before incentives.
For our 11.7 kW (11,700 Watts) system:
11,700 Watts × $3.00/Watt = $35,100 Gross System Cost
Step 2: Apply the 30% Federal Investment Tax Credit (ITC)
The federal government offers a massive tax credit that allows you to deduct 30% of the total gross system installation cost directly from your federal income tax liability.
For our $35,100 system, the credit is worth:
$35,100 × 0.30 = $10,530 Tax Credit Savings
This reduces your actual net out-of-pocket investment to **$24,570** ($35,100 - $10,530).
Step 3: Factor in Net Metering & Utility Savings
Solar panels produce power during the day, which often exceeds your home's active consumption during those hours. With **Net Metering**, this excess power is fed back into the local electrical grid, and your utility meter literally spins backward, giving you credit.

If your utility offers a **1-to-1 Net Metering** policy, every kWh you send to the grid offsets a kWh you draw at night. In this ideal scenario, your annual solar generation offsets your pre-solar electric bill.
Suppose your home previously consumed 15,000 kWh per year at a rate of **$0.16 per kWh**. Your pre-solar annual utility expense was:
15,000 kWh × $0.16 = $2,400 per year
Step 4: Calculate the Payback Period
The **Payback Period** measures the exact number of years it takes for your cumulative utility bill savings to fully recoup your net out-of-pocket installation cost.
Solar Payback Period Equation
Where Cnet is the net system cost after tax credits and Sannual is your total annual utility offset.
Example: For our system: $24,570 net cost ÷ $2,400 annual savings = 10.2 Years.
Because modern tier-1 monocrystalline panels carry a **25-year manufacturer warranty** and typically produce power for 30+ years, your system will provide completely free electricity for nearly two decades after it passes the 10.2-year payback threshold, shielding you entirely from rising utility inflation rates.
4. Key Structural and Site Suitability Checklist
Before signing an installation agreement, a qualified builder or structural engineer must evaluate the physical properties of the property:
- Roof Structural Dead Load: Racks and panels add approximately **3 to 4 pounds per square foot** of static dead load. Older, sagging rafter structures must be structurally reinforced before installation.
- Age of Shingles: Solar panels last 25 to 30 years. If your asphalt shingle roof is 15+ years old, replace the shingles *before* mounting solar. Removing and reinstalling an active array for a subsequent reroofing job carries a high labor fee ($3,000 to $5,000).
- Azimuth & Orientation: The ideal azimuth is **180° (pointing directly South)**. East and West-facing roofs are highly viable but generate roughly 15% less energy. Avoid North-facing slopes entirely, as they do not receive direct sunlight.
Plan Your Solar Upgrade With Confidence
Calculating system capacities, panel spacing constraints, and localized ROI returns is complex. Avoid guesswork and potential mathematical errors. Use our comprehensive, free Solar Panel Sizing & ROI Calculator to instantly calculate your optimal system size, tax savings, required roof space, and payback timeline in seconds.
Frequently Asked Questions
1. What is the average payback period for residential solar?
For most US residential properties, the average solar payback period is between 7 to 12 years. The exact timeline depends heavily on your local utility's electricity rates (higher rates mean faster payback), regional sunlight hours, net metering policies, and local state rebates.
2. How does the 30% Federal Investment Tax Credit work?
The federal ITC is a dollar-for-dollar tax credit that reduces your federal income tax liability. It is equal to exactly 30% of your total solar installation cost (including hardware, labor, and permitting). If your tax liability in the year of installation is less than the credit value, you can roll the remaining balance over to offset your taxes in subsequent years.
3. What is the difference between peak sun hours and daylight hours?
Daylight hours span the entire period from sunrise to sunset. In contrast, a Peak Sun Hour is a standardized unit of solar radiation intensity, defined as any hour where solar irradiance averages 1,000 Watts/m² striking the earth. While a summer day may have 14 hours of ambient daylight, it usually only provides 4 to 6 Peak Sun Hours. Sizing equations rely strictly on peak sun hours.
4. Can I install solar if my roof faces East or West?
Yes, East and West-facing roofs are highly viable and commonly used. However, they receive less direct perpendicular light than South-facing roofs, resulting in a minor 15% to 20% efficiency penalty. To compensate, a builder or designer may increase the system size (adding 2 to 4 extra panels) to meet the targeted annual generation.
About the Author

Hassan Baloch — An experienced Civil Engineer with more than a decade in building and structural planning. Hassan rigorously verifies the mathematical formulas and code compliance of our estimation tools to guarantee absolute precision. Contact our team for technical inquiries.
Related Guides

Is Solar Worth It? A Homeowner's Guide to Panel Costs and Payback
Decide whether solar makes sense for your home. Compare installation costs, tax credits, typical payback periods, and property value impact — then run the numbers in our free solar calculator.

Roof Pitch vs. Angle: The 2026 Guide
Confused about roof pitch versus angle? Understand the mathematics of roofing geometry, learn how to measure it, and accurately use our roof pitch calculator for your next project.
Related Calculators
Solar Panel Calculator
Estimate recommended solar system size, panel count, net costs, tax credits, and payback ROI.
Roof Pitch Calculator
Determine roof pitch, angle, rafter length, and area.

Area & Perimeter Calculator
Calculate area and perimeter for various shapes.